Summary
OncoStemCell™ technology is a 3D cell culture system that selects and enriches the stem cell (CSC) sub-population of cancer cells. Unlike cancer cells cultured on 2D plates or spheroids grown in suspension or naturally-based 3D matrices, cancer cells cultured in OncoStemCell have a high stem cell fraction (exceeding 80%). The target market for OncoStemCell technology is those pharmaceutical companies that are developing therapies targeting CSCs of the tumor tissue. The value proposition is a more reliable and accurate model for in vitro screening of CSC targeting drugs compared with competing products in the market. A more reliable in vitro model with patient-derived CSCs has the potential to significantly decrease preclinical screening cost and reduce the chance of late-stage failure of the drug candidate in clinical trials.
Significance
A major factor contributing to cancer mortality is relapse after surgery, radiation or drug therapy. Breast cancer recurrence affects 30% of the patients while up to 50% of colorectal cancer patients experience relapse. Malignancy in cancer is believed to be related to the existence of a small sub-population of stem cells (CSCs) in the tumor with elevated resistance to cancer therapy. Consistent with that, the most aggressive triple-negative breast cancer or metastatic stage III colon cancer has the highest sub-population of CSCs among different types.
The development of a cancerous tissue is a multiple-step process and regulated by the tumor microenvironment. This process may take many years and is difficult to follow in vivo. Therefore, there is a need to develop in vitro models to study the molecular basis of tumorigenesis and progression and to screen drugs for their effectiveness against the most invasive cells in the tumor. Most in vitro studies use standard two-dimensional (2D) cell culture. However, cells grown on 2D tissue culture behave differently from those grown in physiological 3D environment due to the lack of proper cell-cell and cell-matrix interactions as well as the gradient of nutrients and growth factors, which are known to play critical roles in cancer initiation, progression and metastasis. For example, when cancer cells are cultured on 2D plates, their malignancy is reduced compared to those under in vivo conditions. Animal models are also frequently used to study molecular pathways and drug response in cancer research. In these cases, either animal tumors grown in syngeneic animals or human tumors grown in immunocompromised animals are used. Therefore, animal models may not adequately reproduce the features of human cancers in vivo.
To bridge the gap between the 2D cell culture system and the in vivo system, 3D in vitro cell culture system has emerged as another approach for cancer research. In many 3D models, cell lines or cells from dissociated tissues are embedded in 3D matrices and cultured to promote cell-cell interaction, adhesion, migration and in vivo like morphogenesis. Comparison between 2D and 3D cultures has revealed significant differences in all aspects of cell behavior from cell shape and growth to gene expression and response to stimuli. Various types of materials have been used to generate a 3D matrix. Type 1 collagen and Matrigel™ are the most widely used matrices because they are biocompatible and support adhesion and growth of many cell types. Alginate and agarose gels are also used as a matrix to study the behavior of breast cancer cells under a 3D condition. However, it is difficult to isolate and study cell response to individual factors in the microenvironment with naturally derived matrices that have many interactions with cell surface receptors. Further, highly invasive cancer stem cells and cancer initiating cells tend to grow and form colonies on/in inert and non-adherent matrices/substrates which support cell-cell over cell-substrate interactions. Furthermore, substrate rigidity affects lineage commitment and fate of stem cells. A soft substrate directs differentiation of mesenchymal stem cells (MSCs) to neurogenic lineage whereas a substrate with intermediate and high stiffness leads to the differentiation of MSCs to myogenic and osteogenic lineages, respectively. Substrate rigidity also affects the fate of malignant cells as the rigidity of hyperplastic ERbB2 over-expressing MCF10AT human breast epithelial cells increased in response to higher stiffness of the collagen matrix.
Here, we describe an innovative technology, namely OncoStemCell™ technology, that selectively enriches the highly malignant stem cell sub-population of cancer cells over the differentiated bulk tumor cells. The OncoStemCell technology encapsulates cancer cells in a polyethylene glycol diacrylate (PEGDA) matrix with tunable physical and chemical properties that selectively enriches the malignant stem cell sub-population of cancer cells. Synthetic gels like PEGDA provide enormous flexibility in designing 3D matrices with a wide range of mechanical, physical, and biological properties that are crucial to the maintenance, differentiation, maturation, and fate of the encapsulated cells.
PEGDA synthesis and characterization
The PEG macromer was functionalized with acrylate groups to produce polyethylene glycol diacrylate (PEGDA) by the reaction of acryloyl chloride with hydroxyl end-groups of PEG. After completion of the reaction, the solvent was removed by rotary evaporation and the residue was dissolved in anhydrous ethyl acetate to precipitate the by-product triethylamine hydrochloride salt. Next, ethyl acetate was removed by vacuum distillation; the macromer was re-dissolved in DCM and precipitated twice in ice-cold ethyl ether. The macromer was dissolved in dimethylsulfoxide (DMSO) and dialyzed against distilled deionized (DI) water to remove the by-products. The PEGDA product was freeze-dried and stored at -20ºC. The chemical structure of the functionalized macromer was characterized by 1H-NMR at ambient conditions. The PEGDA macromers were crosslinked in aqueous solution by UV initiated radical polymerization with 4-(2-hydroxyethoxy)phenyl-(2-hydroxy-2-propyl) ketone (Irgacure 2959; CIBA, Tarrytown, NY) photoinitiator. 5 mg of initiator was dissolved in 1 mL PBS at 50ºC. The macromer was dissolved in PBS by vortexing and heating to 50ºC. To prepare 7.5, 10, 15, 20 and 25% PEGDA hydrogel precursor solutions, 22.5, 30, 45, 60 and 75 mg of PEGDA macromer was mixed with 278, 270, 255, 240 and 225 µL of the initiator solution, respectively, by vortexing for 5 min. For cell loading, 1.4 ×10⁵/mL 4T1 cells suspended in PBS were added to the macromer solution and mixed gently with a glass rod. The hydrogel precursor solutions were degassed and transferred to a PTFE mold (5 cm × 3 cm × 750 µm ), covered with a transparent glass plate, fastened with clips, and UV irradiated with a BLAK-RAY 100-W mercury long wavelength (365 nm) UV lamp (Model B100-AP; UVP, Upland, CA) for 10 min. Disc shape samples were cut from the gel using an 8 mm cork borer and swollen in PBS for 24 h at 37ºC. To measure the gel’s elastic modulus, samples were loaded on the Peltier plate of the rheometer (TA Instruments, New Castle, DE) and subjected to a uniaxial compressive force at a displacement rate of 7.5 µm/s. The slope of the linear fit to the stress-strain curve for 5-10% strain was taken as the elastic modulus (E) of the gels.
Encapsulation of cancer cells in PEGDA hydrogel
PEGDA macromer was dissolved in PBS and sterilized by filtration with a 0.2 µm filter. Next, 1.4 ×10⁵/mL 4T1 mouse breast cancer cells or MCF7 human breast cancer cells suspended in PBS were added to the macromer solution with final PEGDA concentrations ranging 5-25 wt%, and mixed gently. The cell-suspended hydrogel precursor solution were crosslinked in aqueous solution by ultraviolet initiated radical polymerization with Irgacure 2959 as photoinitiator. To prepare 7.5, 10, 15, 20 and 25% PEGDA hydrogel precursor solutions, 22.5, 30, 45, 60 and 75 mg of PEGDA macromer was mixed with 278, 270, 255, 240 and 225 µL of the initiator solution, respectively. For cell loading, 1.4 ×10⁵/mL 4T1 cells suspended in PBS were added to the macromer solution and mixed gently. The hydrogel precursor solutions were degassed and transferred to a PTFE mold, covered with a transparent glass plate, fastened with clips, and UV irradiated with a mercury long wavelength (365 nm) UV lamp for 10 min. Disc shape samples were cut from the gel using an 8 mm cork borer and swollen in PBS for 24 h at 37ºC. To measure the gel’s elastic modulus, samples were loaded on the Peltier plate of the rheometer and subjected to a uniaxial compressive force at a displacement rate of 7.5 µm/s. The slope of the linear fit to the stress-strain curve for 5-10% strain was taken as the elastic modulus (E) of the gels. After crosslinking, the gel was cut into disks and incubated in stem cell culture medium in ultra-low attachment tissue culture plates under 5% CO2.
Cell imaging, determination of cell number, and mRNA analysis
To determine cell viability, gels were stained with cAM/EthD live/dead dyes 2 days after encapsulation to image live and dead cells, respectively. Stained samples were imaged with an inverted fluorescent microscope. At each time point, the gel samples were removed from the culture media and stained for imaging. Samples were rinsed twice with PBS and fixed with 4% paraformaldehyde for 3 h. After fixation, cells were permeabilized using PBS containing 0.1% Triton X-100 for 5 min. After rinsing, cells were incubated with Alexa 488 phalloidin (1:200 dilution) and DAPI (1:5000 dilution) to stain actin filaments of the cell cytoskeleton and cell nuclei, respectively. Stained samples were imaged with an inverted fluorescent microscope. For determination of cell number, the gel samples were homogenized, cells were lysed, and aliquots were used to measure the double stranded DNA (dsDNA) content using a Quant-it PicoGreen assay as described. Total cellular RNA of the gel samples was isolated using TRIzol as described. The extracted purified RNA was reverse transcribed to cDNA by SuperScript II Reverse Transcriptase with the random primers. The obtained cDNA was subjected to real time quantitative polymerase chain reaction (RT-qPCR) amplification with appropriate gene specific primers. RT-qPCR was performed to analyze the differential expression of CSC markers CD44 (4T1 and MCF7), CD24 (4T1), ABCG2 (4T1 and MCF7), and SCA1 (4T1) genes with SYBR green RealMasterMix using a PCR system. The expression level of GAPDH gene was used as an internal control. The relative gene expression levels were quantified by the 2^–ddCT method as described. The relative gene expressions were expressed as fold difference compared with that at time zero.
Results
Fluorescent images in Figure 1 show the extent spheroid formation with incubation time by 4T1 encapsulated gels with modulus of 2.5 kPa (Figure 1 column A), 5.3 kPa (Figure 1 column B), 47.5 kPa (Figure 1 column C), and MCF7 encapsulated gel with 5.3 kPa (Figure 1 column D). Rows 1, 2, 3, and 4 in Figure 1 correspond to incubation times of 5, 8, 11, and 14 days, respectively. Spheroid formation was observed in soft gels with moduli of 2.5 and 5.3 kPa as early as day 5 (columns A, B, and D in Figure 1) while cells in the more stiff gels with modulus of 47.5 kPa and higher remained as single cells or small cell aggregates (<25 µm). MCF7 human breast cancer cells also formed spheres when encapsulated in the gel with modulus of 5.3 kPa (Figure1 column D). At any time point, size of the tumorspheres in the 5.3 kPa gel was higher than that of 2.5 kPa gel. The size of MCF7 spheroids in the gels was less than that of 4T1.
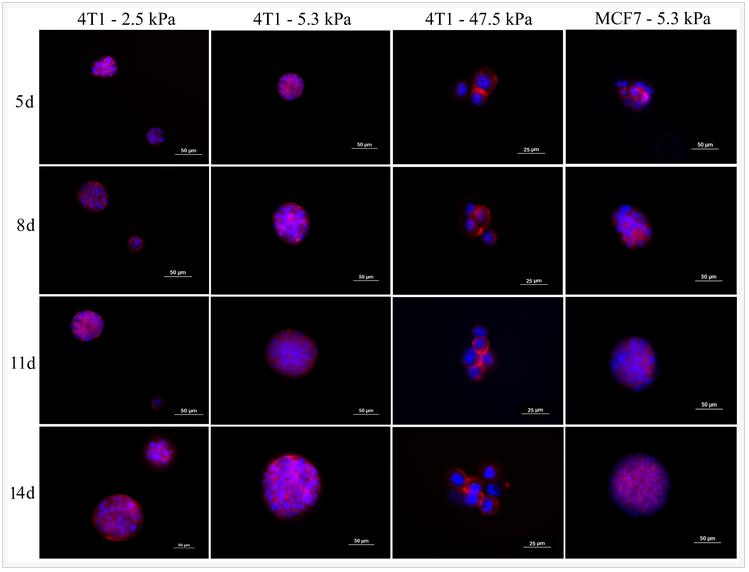
Figure 1. Evolution of tumorsphere formation by 4T1 tumor cells encapsulated in PEGDA hydrogels with elastic modulus of 2.5 kPa (left column), 5.3 kPa (center left column), 47.5 kPa (center right column), and MCF7 tumor cells encapsulated in the 5.3 kPa gel (left column) as a function of incubation time. Rows 1, 2, 3, and 4 correspond to incubation times of 5, 8, 11, and 14 days, respectively. At each time point, encapsulated cells were stained with phalloidin for cytoskeleton (red) and DAPI for nucleus (blue), and imaged with an inverted fluorescent microscope.
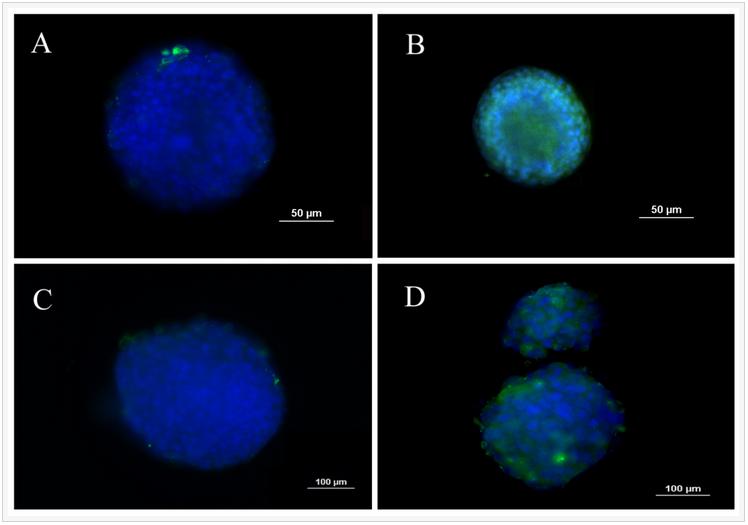
One of the unique properties of CSCs is asymmetrical division and retention of DNA labeling. Based on this feature, BrdU retention is a commonly used method to characterize CSCs. 4T1 cells were labeled with BrdU before encapsulation in the PEGDA gel with 5.3 kPa modulus and the intensity of BrdU staining was compared with those cells cultured on ultra-low attachment plates. Figure 2 compares BrdU staining of 4T1 cells in suspension culture on ultra-low attachment plates (A and C) with those encapsulated in PEGDA hydrogels (B and D). Images A and B in Figure 2 are after 8 days of culture while images C and D are after 14 days. After 8 and 14 days, cells encapsulated in the gel displayed higher level of BrdU retention than those in suspension cultures, demonstrating that the encapsulated tumorspheres had higher fraction of CSCs.

Figure 2. BrdU staining of 4T1 tumorspheres formed in suspension culture on low adhesion plates (A and C) and formed by encapsulation in PEGDA hydrogels (B and D). Images A and B are after 8 days of incubation while images C and D are after 14 days. Prior to tumorsphere formation, 4T1 cells were incubated with BrdU for 10 days to achieve stable labeling. The presence of BrdU in the cells was confirmed by immunofluorescent staining (green). The cell nuclei were stained with DAPI (blue).
ABCG2 of ABC transporter proteins is responsible for CSC drug resistant and SCA1 (stem cell antigen-1) is a cell surface protein known to be associated with breast CSCs. CD44 and ABCG2 are well-studied markers in both mouse and human breast cancer stem cells. The expressions of breast CSC markers for tumorspheres grown in PEGDA gels with different moduli are shown in Figure 3. Figures 3A-D show the expression of CD44, CD24, ABCG2, and SCA1 for 4T1 cells and Figures 3E-F show the expression of CD44 and ABCG2 for MCF7 cells. 4T1 cells in the gel with elastic modulus of 5.3 kPa had the highest CD44 expression and lowest CD24 expression for all time points. CD44 expression of 4T1 and MCF7 cells initially increased and reached a maximum at day 8 for 2.5 and 5.3 kPa gels and at day 11 for 26.1 kPa gel. CD44 expression then decreased with incubation time. 4T1 and MCF7 cells encapsulated in the gels with moduli of 47.5 and 68.6 kPa did not show an increase in CD44 expression in 14 days. This biphasic marker expression with time was also observed for ABCG2 marker in 4T1 and MCF7 cells. At day 8, CD44 and ABCG2 expression of 4T1 cells increased by 2.2 and 1.8 folds, respectively, with increase in gel modulus from 2.5 to 5.3 kPa; those for MCF7 cells increased by 1.2 and 1.7 folds with increase in gel modulus from 25 to 5.3 kPa.
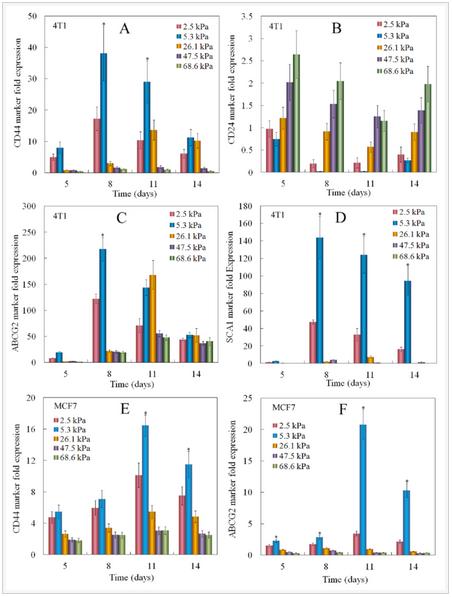
Figure 3. Effect of gel elastic modulus on the relative mRNA expression levels of CD44 (A), CD24 (B), ABCG2 (C), Sca1 (D) markers of 4T1 cells, and CD44 (E), ABCG2 (F) markers of MCF7 cells encapsulated in PEGDA hydrogels with incubation time. The mRNA expression levels of the markers for 4T1/MCF7 cells before encapsulation were used as reference (set equal to one).
The cell number and gene expression by human triple-negative MDA-MB-231 breast cancer cells cultured in 2D and 3D PEGDA gel are compared in Figure 4. Groups included MDA-MB-231 cells on 2D adherent plates and cultured in RPMI-1640 medium (2D-RPMI), cells on 2D plates and cultured in CSC medium (2D-CSC), and cells encapsulated in the 5 kPa PEGDA gel and cultured in CSC medium (3D-CSC). Cell numbers increased for all groups with incubation time but the increase was higher for the 2D groups (Figure 4A, 3D-CSC group statistically lower cell number than the 2D groups). For any time point, the cell number for 2D-CSC group was slightly higher than 2D-RPMI but the difference was not statistically significant. For any time point, the cell number for 3D-CSC was significantly lower than the 2D groups because cell growth in the non-adherent PEGDA gel was limited to the stem cell sub-population. The expression of CD44, ABCG2, and EGFR CSC markers in the 2D groups (blue and green curves) did not increase with incubation time and the difference in marker expression between 2D-1640 and 2D-CSC groups was not significant (Figures 4B-D). The expression of CSC markers for the cells in 3D-CSC group was much higher than those in 2D groups (red curve Figures 4B-D, statistically higher than the 2D groups). The results in Figure 4 demonstrated that the higher expression of CSC markers for cells in 3D-CSC group was related to the encapsulation of cancer cells in PEGDA gel, not the change in culture medium.
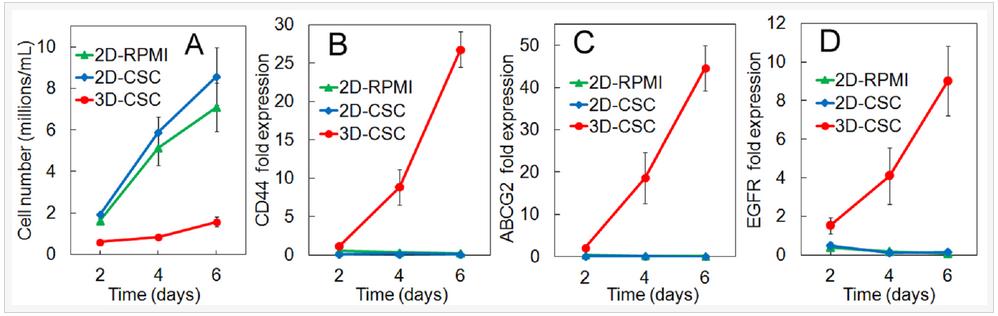
Figure 4. Number density (A) and mRNA expression of CD44 (B), ABCG2 (C), and EGFR (D) markers for MDA-MB-231 cells as a function of incubation time. Groups included cells on 2D adherent plates and cultured in RPMI-1640 medium (2D-RPMI), cells on 2D plates and cultured in CSC medium (2D-CSC), and cells encapsulated in the 5 kPa PEGDA gel and cultured in CSC medium (3D-CSC).
Flow cytometry was used to quantify the CSC fraction (CD44+/CD24-) of MDA-MB-231 tumorspheres grown in 5 kPa PEGDA gel. Groups included cells cultured on adherent tissue culture plate (TCP, Figure 5A), cells on non-adherent TCP (suspension culture, Figure 5B), cells encapsulated in Matrigel™ with 500 Pa stiffness (Figure 5C), cells encapsulated in the un-patterned 5 kPa PEGDA gel (Figure 5D), and in the 50 µm patterned gel (Figure 5E). All groups were cultivated for 8 days. CSC fraction of MDA-MB-231 cells cultured on adherent plates was 8.3% close to the previously reported CSC fraction, which increased slightly to 11% by suspension culture and 9.3% by encapsulation in Matrigel™. Encapsulation of MDA-MB-231 cells in the 5 kPa un-patterned and 50 µm patterned gels markedly increased the CSC fraction to 48% and 70%, respectively. The for cytometry results clearly demonstrate that the OncoStemCell technology selectively enriches the stem cell sub-population of cancer cells which is the sub-population responsible for cancer metastasis, drug resistance, and cancer relapse.
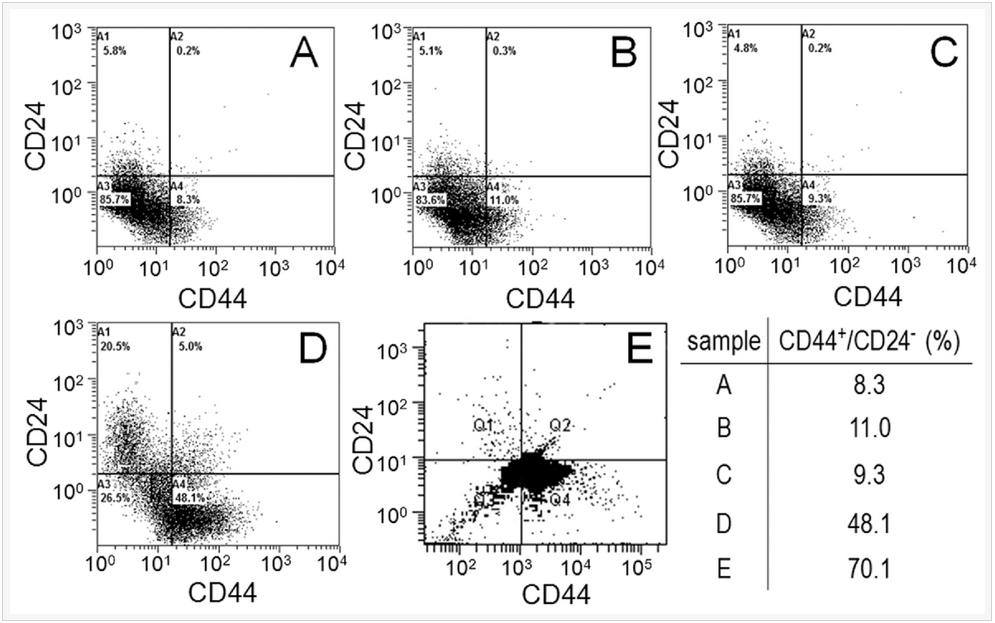
Figure 5. MDA-MB-231 cells cultured on adherent tissue culture plate (TCP, A), non-adherent tissue culture plate (suspension, B), by encapsulation in Matrigel (C), encapsulation in un-patterned 5 kPa PEGDA gel (D), and encapsulation in 50 µm patterned 5 kPa PEGDA gel; (F) CSC fraction of the MDA231 cells in (A-E) as the sub-population of cells in the fourth quadrant (CD44+/CD24-).
The effect of tissue origin on optimum matrix stiffness for growth and expression of CSC markers was investigated with MCF7 and MDA231 breast, HCT116 colorectal, AGS gastric, and U2OS osteosarcoma cells encapsulated in PEGDA gels with compressive modulus ranging from 2 to 70 kPa. Non-tumorigenic MCF10A cells did not form tumorsphere (first column in Figure 6A) whereas all cancer cells formed tumorspheres after 9 days of encapsulation in the gel (Figure 6A). The increase in cell number and sphere number with incubation time depended on cancer cell type (Figures 6B-C). The cell number of triple-negative (claudin-low) MDA-MB-231 and luminal-A MCF7 breast cancer cells after 9 days encapsulation in the 5 kPa gel was 1.6±0.1×10⁶ and 1.0±0.1×10⁶ cells/mL, respectively, and the sphere number density was 5.4±0.3×10³ and 2.3±0.3×10³ spheres/mm3 (Figures 6B-C). The dependence of cell number and sphere number on modulus for all cancer cells was bimodal (Figures 6B-C). The optimum gel modulus with respect to tumorsphere growth and expression of CSC markers was 5 kPa for MCF7 and MDA-MB-231 breast cancer cells, 25 kPa for HCT116 and AGS gastrointestinal cells, and 50 kPa for U2OS osteosarcoma cells (Figures 6B-C). For example, number of MDA-MB-231 tumorspheres after 9 days incubation in the gels with 2, 5, 25, 50, and 70 kPa modulus was 1.6±0.2, 5.4±0.3, 1.2±0.2, 0, and 0 spheres/mm3 whereas for U2OS cells it was 0, 0, 0.05±0.01, 0.77±0.25, and 0 spheres/mm3. Expression of CD44 marker was used to characterize the CSC sub-population of all cancer cells. ABCG2 expression was used as the second marker for MCF7 CSCs, EGFR for MDA231 CSCs, TGF-β for HCT116 CSCs, OCT4 for AGS CSCs, and CD133 for U2OS CSCs. Expression of CSC markers for cancer cells encapsulated in PEGDA gel as a function of modulus (Figure 6D) was consistent with cell densities, tumorsphere sizes and number densities in Figures 6B-C. For time points of 6 and 9 days, optimum gel modulus with respect to the expression of CSC markers was 5 kPa for MCF7 and MDA-MB-231 cells, 25 kPa for HCT116 and AGS cells, and 50 kPa for U2OS cells (Figure 6D).
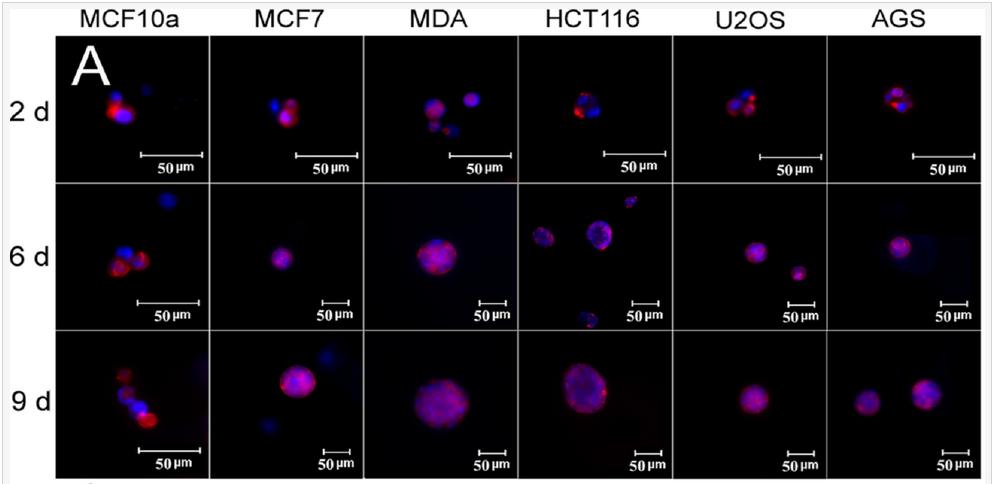
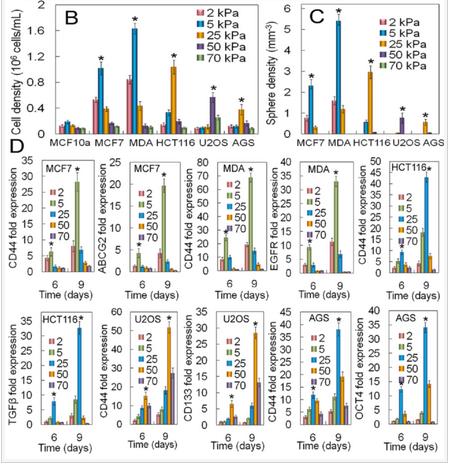
Figure 6. (A) DAPI (blue) and phalloidin (red) stained images of MCF10A, MCF7, MDA231, HCT116, U2OS, and AGS cancer cells encapsulated in PEGDA gels after 2, 6, and 9 days of incubation (scale bars in A are 50 µm). The gel modulus in (A and E) was the optimum PEGDA modulus of 5 kPa for MCF7 and MDA231 cells; 25 kPa for HCT116 and AGS; 50 kPa for U2OS. Cell number (B) and tumorsphere number (C) as a function of cancer cell type after 9 days of encapsulation for gel moduli of 2 (pink), 5 (blue), 25 (brown), 50 (purple), and 70 (green) kPa. The gel modulus in (A and E) was the optimum PEGDA modulus of 5 kPa for MCF7 and MDA231 cells; 25 kPa for HCT116 and AGS; 50 kPa for U2OS. (D) mRNA expression of CSC markers for MCF7 (CD44 and ABCG2), MDA231 (CD44 and EGFR), HCT116 (CD44 and TGF-β), U2OS (CD44 and CD133), and AGS (CD44 and OCT4) after 6 and 9 days of encapsulation for gel moduli of 2 (pink), 5 (blue), 25 (brown), 50 (purple), and 70 (green) kPa.
mRNA expression of EMT markers for MDA-MB-231 cells encapsulated in 5 kPa PEGDA gel is shown in Figure 7(A-H). As incubation time was increased from day 2 to 6, E-cadherin expression of the cells decreased initially reaching a minimum on day 3 whereas the expression of N-Cadherin, Snail, Twist, Vim, and ZEB2 was bimodal with a peak value on day 4 with the exception of slug which peaked on day 3 (Figures 7AB,D-H). Expression of TGF-β steadily increased with incubation time (Figure 7C). The expression of pYAP, total YAP, and YAP/TAZ transcription factors for MDA-MB-231 cells encapsulated in the PEGDA gel as a function of gel modulus is shown in Figures 7(I-K) after 6 days of incubation. Expression of pYAP was lowest and that of YAP/TAZ was highest for tumorspheres in the 5kPa gel as compared to those in 2.5 and 25 kPa (Figures 7I,K).
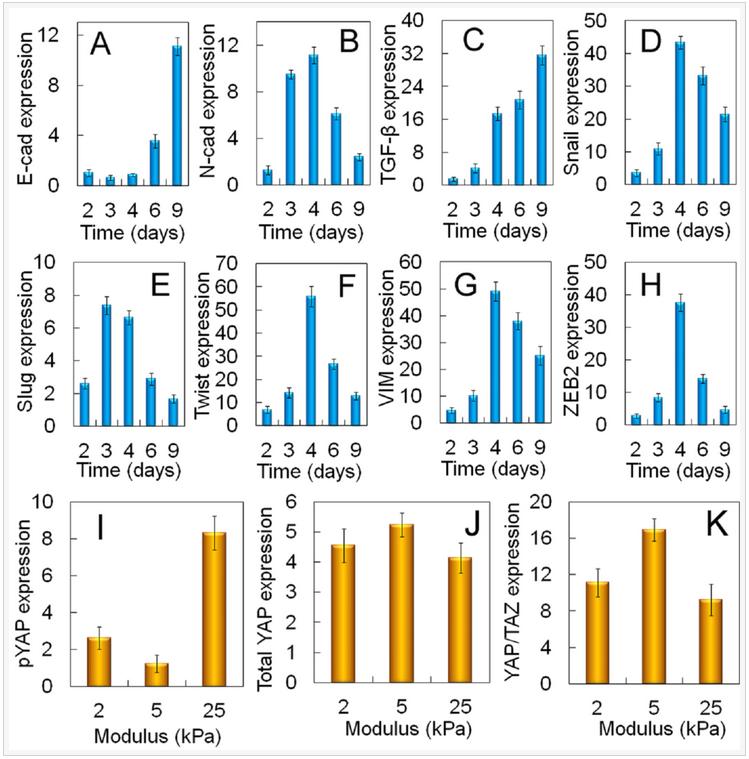
Figure 7. Dependence of tumorsphere growth on EMT marker expression for MDA-MB-231 cells. mRNA expression of EMT markers E-cadherin (A), N-cadherin (B), TGF-β (C), Snail (D), Slug (E), Twist (F), Vimentin (G), and ZEB2 (H) for MDA231 cells encapsulated in the un-patterned 5 kPa gel as a function of incubation time. Protein expression of pYAP (I), total YAP (J), YAP/TAZ (K) for the MDA-MB-231 cells encapsualted in the un-patterned gel as a function of modulus after 6 days of incubation.
Activation of EMT is in response to the innate ability of cancer cells to grow and invade. A sub-population of the encapsulated cancer cells in the gel formed a confluent cell layer held together by cell-cell interaction and a fraction of the confluent cells underwent EMT, as shown by the up-regulation of EMT markers (Figure 7) and grew to form tumorspheres by pushing against the retractive force of the gel matrix. Therefore, mechanotransduction may have played a role in the growth of tumorspheres in the gel with incubation time. Results show a link between the Hippo transducers and CSC growth via the Yes-associated protein and its transcriptional co-activator with PDZ-binding motif (YAP/TAZ) in cancer cells during EMT. Upstream regulators of the Hippo transducers include the G protein-coupled receptors (GPCRs, G12/13), regulated by lipid rafts on the cell surface, that change conformation in response to the elastic force exerted by the matrix. The conformational change leads to dephosphorylation of YAP/TAZ, their nuclear localization, and CSC growth. The higher expression of YAP/TAZ transcription factors at the optimum modulus of PEGDA gels led to the expression of genes responsible for EMT and up-regulation of CSC markers in MDA-MB-231 cancer cells.
Summary
This innovative technology demonstrates for the first time that synthetic hydrogels can selectively enrich the stem cell sub-population of cancer cells. This tool is useful for screening cancer drugs against the most invasive sub-population of cancer cells.